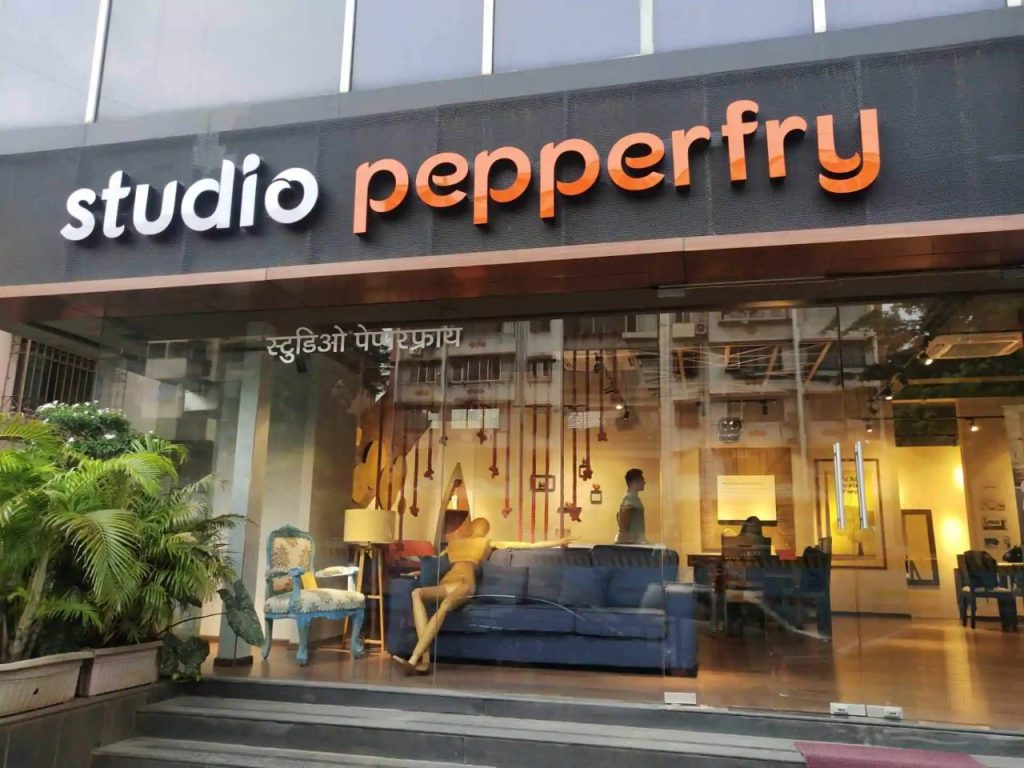
Pepperfry Statistics, Goals and Users
Ambareesh Murty and Ashish Shah established Pepperfry in 2011 as India’s leading online furniture and home decor marketplace. Pepperfry is headquartered in Mumbai. This company offers furniture, home decor items, lighting, furnishings, and kitchen essentials. They are known for high-quality, stylish, and affordable home solutions. They offer Made-to-Order and Ready-to-Ship options with offline studios. The Pepperfry platform has become the most preferred online platform for interior designers to offer stylish home decor.
If you are looking for Pepperfry coupons and deals you can check here –https://www.99cashdeals.com/stores/pepperfry-coupons
Revenue from Operations of Mamaearth
The challenges faced by Pepperfry in scaling operations didn’t hinder the revenue growth of the company, as indicated in the following table. In FY 2020-21, the company saw a growth of ₹ 201 crores. FY 2021-22, saw a growth of ₹ 247 crores, with Year-over-Year Growth observed at 23%. FY 2022-23, saw a growth of ₹ 272.3 crores, with Year-over-Year Growth observed at 10 e-commerce companies Pepperfry has reported the following figures for fiscal years:
| Fiscal Year | Revenue from Operations (₹ Crore) | Year-over-Year Growth |
| FY 2020-21 | 201 | — |
| FY 2021-22 | 247 | 23% |
| FY 2022-23 | 272.3 | 10% |
Number of Pepperfry Users
Pepperfry, a prominent Indian online furniture and home décor marketplace, has experienced significant growth in its user base and website traffic from 2020 to 2024. Pepperfry in the year 2020, saw 7 million monthly website visits for over 4.5 million registered users. By 2023, online engagement saw 7 million registered users, with 22.5 million monthly visits. By October 2024, Pepperfry saw 1.85 million visits, which saw a decrease of 13.26% decrease compared to September. Digital footprint and user engagement enhancement being the top priority of Pepperfry, their efforts seem to be yielding results in the platform for interior designers. Below is a summary of the available data:
| Year | Registered Users | Monthly Website Visits |
| 2020 | 4.5 million | 7 million |
| 2023 | 7 million | 22.5 million |
| 2024 | Data not specified | 1.85 million (October) |
Pepperfry Financial Statistics
Pepperfry managed to achieve revenue of ₹201 crore in the FY 2020-21. In FY 2021-22, revenue collected was ₹201 crores, with an increase of 23% increase while making revenue of ₹246.9 crore. The following year, FY 2022-23 companies’ growth trajectory increased with a 10% rise while achieving revenue of ₹272.3 crore. The financial report of the company is as follows:
| Fiscal Year | Revenue from Operations (₹ Crore) | Year-over-Year Growth |
| 2020-21 | 201 | — |
| 2021-22 | 246.9 | 23% |
| 2022-23 | 272.3 | 10% |
Pepperfry Studios

Pepperfry relies on a studio network management process to generate its revenue. In 2020, they focused on the urban market with over 60 studios. In 2021, they increased their studios up to 100 while expanding in tier 2 cities. In 2022, Pepperfry increased its studios to 150 while strengthening its omnichannel presence. In 2023 studios increased to 200+ while seeing year-over-year by 40%. Projected increase of 250+ stores in 2024, they are targeting nationwide expansion in small towns. Domination in the furniture and home décor market is its strategy in widespread retail footprint.
| Year | Number of Pepperfry Studios | Details |
| 2020 | 60 | Focused on key urban markets |
| 2021 | 100 | Rapid expansion into Tier-2 cities |
| 2022 | 150 | Strengthened omnichannel presence |
| 2023 | 200+ | Studios grew by 40% year-over-year |
| 2024 (Projected) | 250+ | Nationwide expansion targeting smaller towns |
Pepperfry Market Share
The market share of Pepperfry was about 60-65% share of India’s online furniture market. This market share displayed its dominance in the market. By 2022, its company market share was about 50% showcasing sustained leadership in a competitive market. Pepperfry is seeing substantial double-digit growth marking its expansion into organised capturing of additional shares.
| Year | Market Share | Details |
| 2020 | 60-65% | Dominant position in the online furniture segment. |
| 2021 | 60-65% | Continued stronghold with consistent market presence. |
| 2022 | 50% | Sustained leadership with half of the market share. |
| 2023 | Data not specified | Ongoing efforts to capture additional market share in the organized segment. |
| 2024 | Data not specified | Targeting significant double-digit growth and expansion into more markets. |


